

The classic example of a Simpson’s paradox
When analyzing data, we sometimes get unusual results that contradict previous research.
In 1996, researchers presented an interesting result from a twenty-year follow-up of the Whickham Survey. A part of the study, which included 1,314 women, showed that smokers in this study appeared to live longer (76% 443/582) than women who had never smoked (69% 502/732). This finding seems to go against scientific evidence about the harms of smoking. (Table 1)
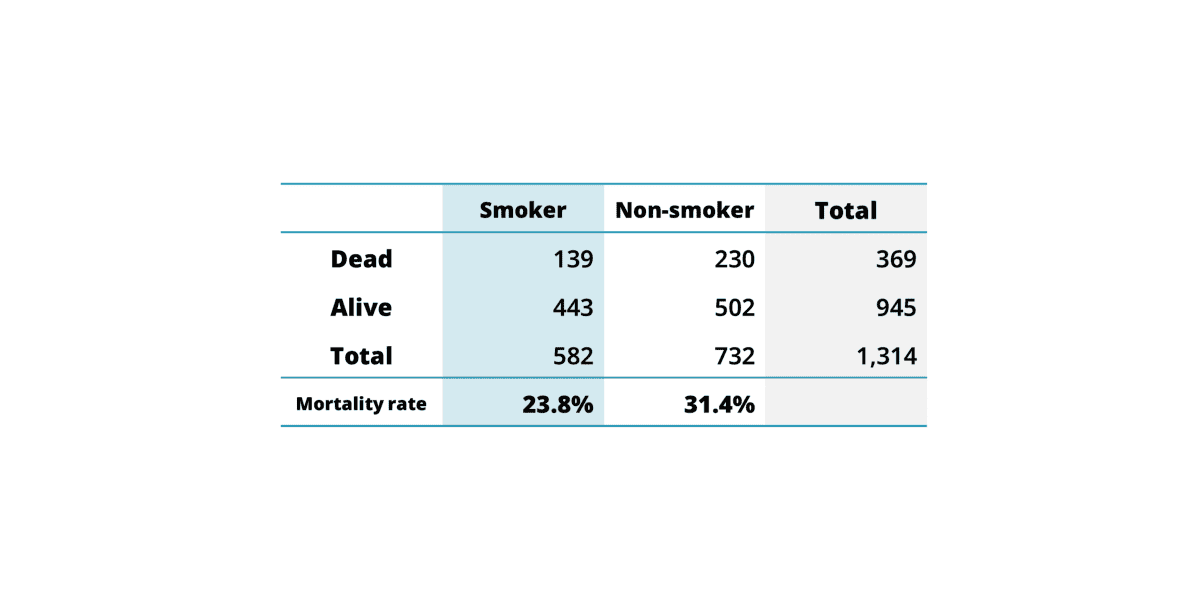
Table 1. Relationship Between Smoking Habits and 20-Year Survival in 1,314 Women
[Adapted from Appleton, D. R., French, J. M., & Vanderpump, M. P. J. (1996). Ignoring a covariate: An example of Simpson’s paradox. The American Statistician, 50(4), 340-341. https://doi.org/10.1080/00031305.1996.10473563 ]
But when looking into the data separated by age, the group of smokers in almost all age groups had a higher mortality rate than the non-smoker group. (Table 2)
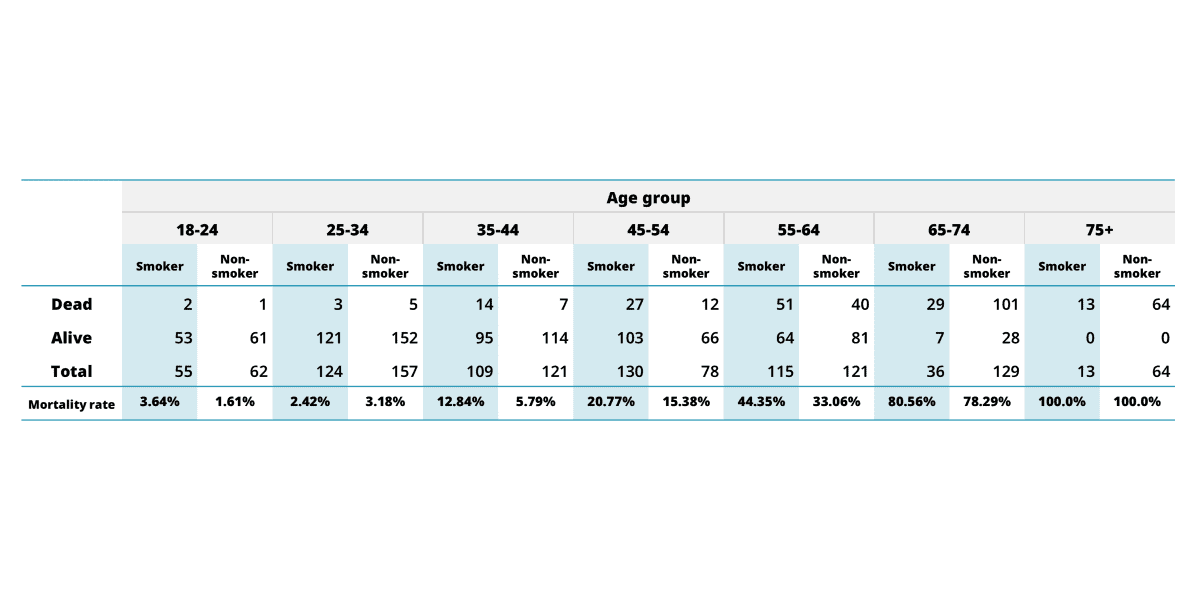
Table 2 Number of Women smokers and Non-smokers in different age groups, showing their 20-year survival status.
[Adapted from Appleton, D. R., French, J. M., & Vanderpump, M. P. J. (1996). Ignoring a covariate: An example of Simpson’s paradox. The American Statistician, 50(4), 340-341. https://doi.org/10.1080/00031305.1996.10473563 ]
The findings of this study are controversial and have differed across various studies. Therefore, the conclusions drawn must be considered carefully. Sometimes, statistical errors can arise when comparing the averages or correlations within each group to those of the combined data, leading to trends that may conflict. This conflicting result is known as Simpson’s Paradox, where group-level trends can differ from the overall trend.
What is Simpson’s Paradox?
Simpson’s Paradox is a statistical phenomenon where an association between two variables in a population emerges, disappears or reverses when the population is divided into subpopulations. For instance, two variables may be positively associated in a population, but be independent or even negatively associated in all subpopulations. Cases exhibiting the paradox are unproblematic from the perspective of mathematics and probability theory, but nevertheless strike many people as surprising. Additionally, the paradox has implications for a range of areas that rely on probabilities, including decision theory, causal inference, and evolutionary biology. Finally, there are many instances of the paradox, including in epidemiology and in studies of discrimination, where understanding the paradox is essential for drawing the correct conclusions from the data.
Simpson’s Paradox (Stanford Encyclopedia of Philosophy)
https://plato.stanford.edu/ENTRIES/paradox-simpson/
FeLV case from our database
Let’s examine an interesting example in which summarizing the same dataset yields different conclusions. In the case of the feline leukemia virus (FeLV) from the MoZWE database, classify the data by sex for 932 samples, as shown in the table below.
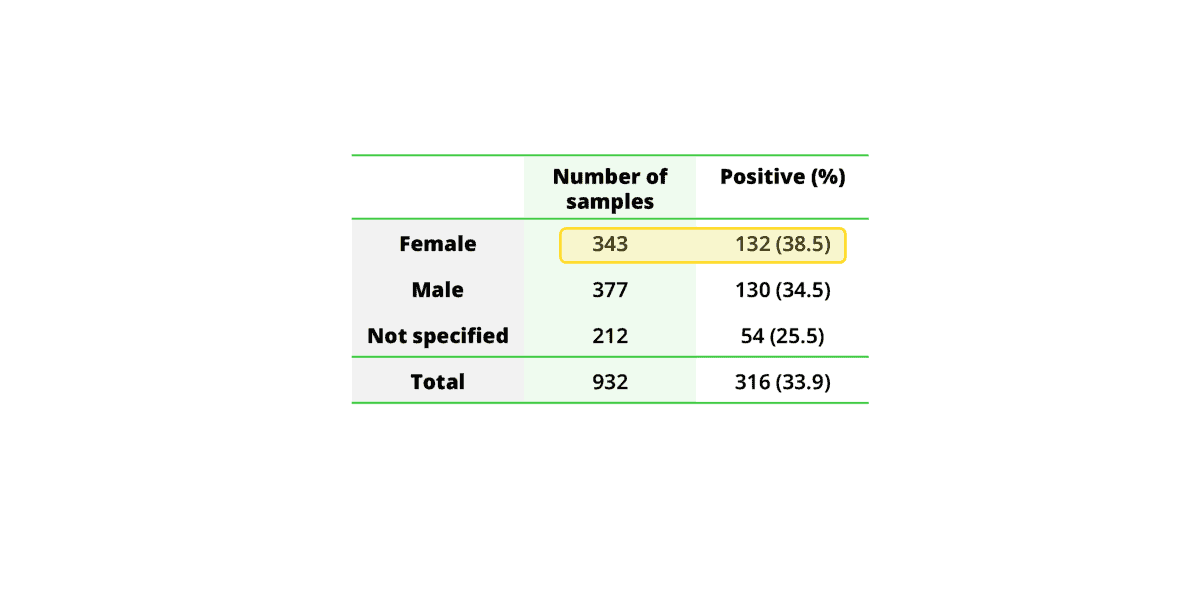
Table 3. Sample with positive result in feline leukemia virus classified by sex with 932 animal samples
[From MoZWE database]
The results from the above information look like the incidence of FeLV in females was 38.5% (132/343), whereas in males the incidence of FeLV was 34.5% (130/377). According to such information, it appears that females are more likely to be infected than males.
In this case, we perform an in-depth analysis (Drill Down) to see what the real cause of the data is. To find latent variables by including Species in the variables.
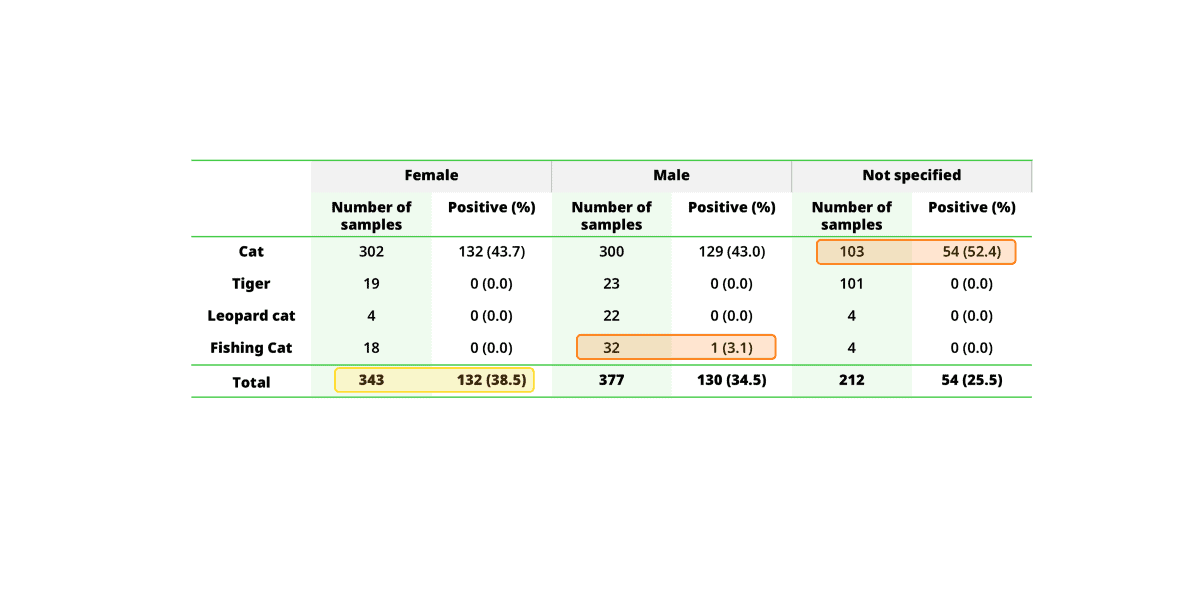
Table 4. Feline leukemia virus outcome is classified by species
[From MoZWE database]
When analyzing the age groups in the table above, it is found that the unspecified sex category has a higher infection rate than the other groups, and that male fishing cats have a higher infection rate than females.
The results of the analysis are contrary to the conclusions when considering the overall.
The data discrepancy in this case happens due to sampling bias. This example shows how the way data is presented can be misleading. To avoid misinterpretation caused by Simpson’s Paradox, data analysts should look for latent variables.
References
- Appleton, D. R., French, J. M., & Vanderpump, M. P. J. (1996). Ignoring a covariate: An example of Simpson’s paradox. The American Statistician, 50(4), 340-341. https://doi.org/10.1080/00031305.1996.10473563
- Stanford Encyclopedia of Philosophy – Simpson’s Paradox
- Simpson’s Paradox: ตัวแปรแฝงที่เปลี่ยนแปลงข้อสรุป กับ 2 กรณีตัวอย่างที่น่าเหลือเชื่อ

Aeknarin Saechin
Academic Statistician, The Monitoring and Surveillance Center for Zoonotic Diseases in Wildlife and Exotic Animals (MoZWE)